

Key Executive Summary Conclusions

are being developed, including institutional responsibilities, reporting processes and coordination arrangements. These structures require further consolidation, stronger administrative and analytical capacity, improved data coordination and sustained political ownership.
Delays in the notification of final NECPs and—with one exception—late submission of the first NECP Reports (NECPRs) undermine predictability and should be avoided in future planning and reporting cycles. The first NECPRs revealed significant gaps in data availability, institutional coordination and consistency. These shortcomings should be addressed ahead of the 2027 reporting cycle, including through clearer responsibilities, stronger coordination with statistical authorities and closer alignment between NECP and NECPR reporting on policies and measures.

required by the Energy Community framework. However, credible delivery requires stronger links and consistency between targets, policies and measures, projections, investment needs and financing assumptions.

and the first NECPRs—submitted too close in time to adoption of the NECPs—cannot yet provide a sufficiently complete and reliable picture of progress towards the 2030 targets or of implementation of the underlying policies and measures.

should shift from establishing structures, capabilities and processes to implementation, mobilising investment and preparing the next iteration of NECPs for the 2030–2040 period, while maintaining alignment with the evolving Union governance framework and 2040 ambitions.

when most NECPs were still being developed and many structural reforms, policies and investment measures remained at the planning stage. The reported data therefore show where the Contracting Parties stood before full implementation began and provide a benchmark against which future progress can be measured.
Progress towards the 2030 energy and climate targets
-
Greenhouse gas emissions
2030–2050 NECP projections for total GHG emissions by Contracting Party
The below figure shows actual GHG emissions from 2014–2022/2023, linear trends based on this historical 10-year period, and the linear trajectories that Contracting Parties should not exceed in order to achieve their 2030 GHG targets. According to their progress reports, some Contracting Parties already seem to be on track towards meeting their obligations by 2030, while others need to urgently start NECP implementation to align with their 2030 energy and climate target trajectories.The 2025 NECPRs reflect on a period, when most NECPs were still being developed and many structural reforms, policies and investment measures remained at the planning stage. The reported data therefore show where the Contracting Parties stood before full implementation began and provide a benchmark against which future progress can be measured.
Actual GHG emissions 2014–2022/2023, linear trends based on 2014–2022/2023, and linear trajectories towards achieving the 2030 GHG targets, [Mt CO2eq]
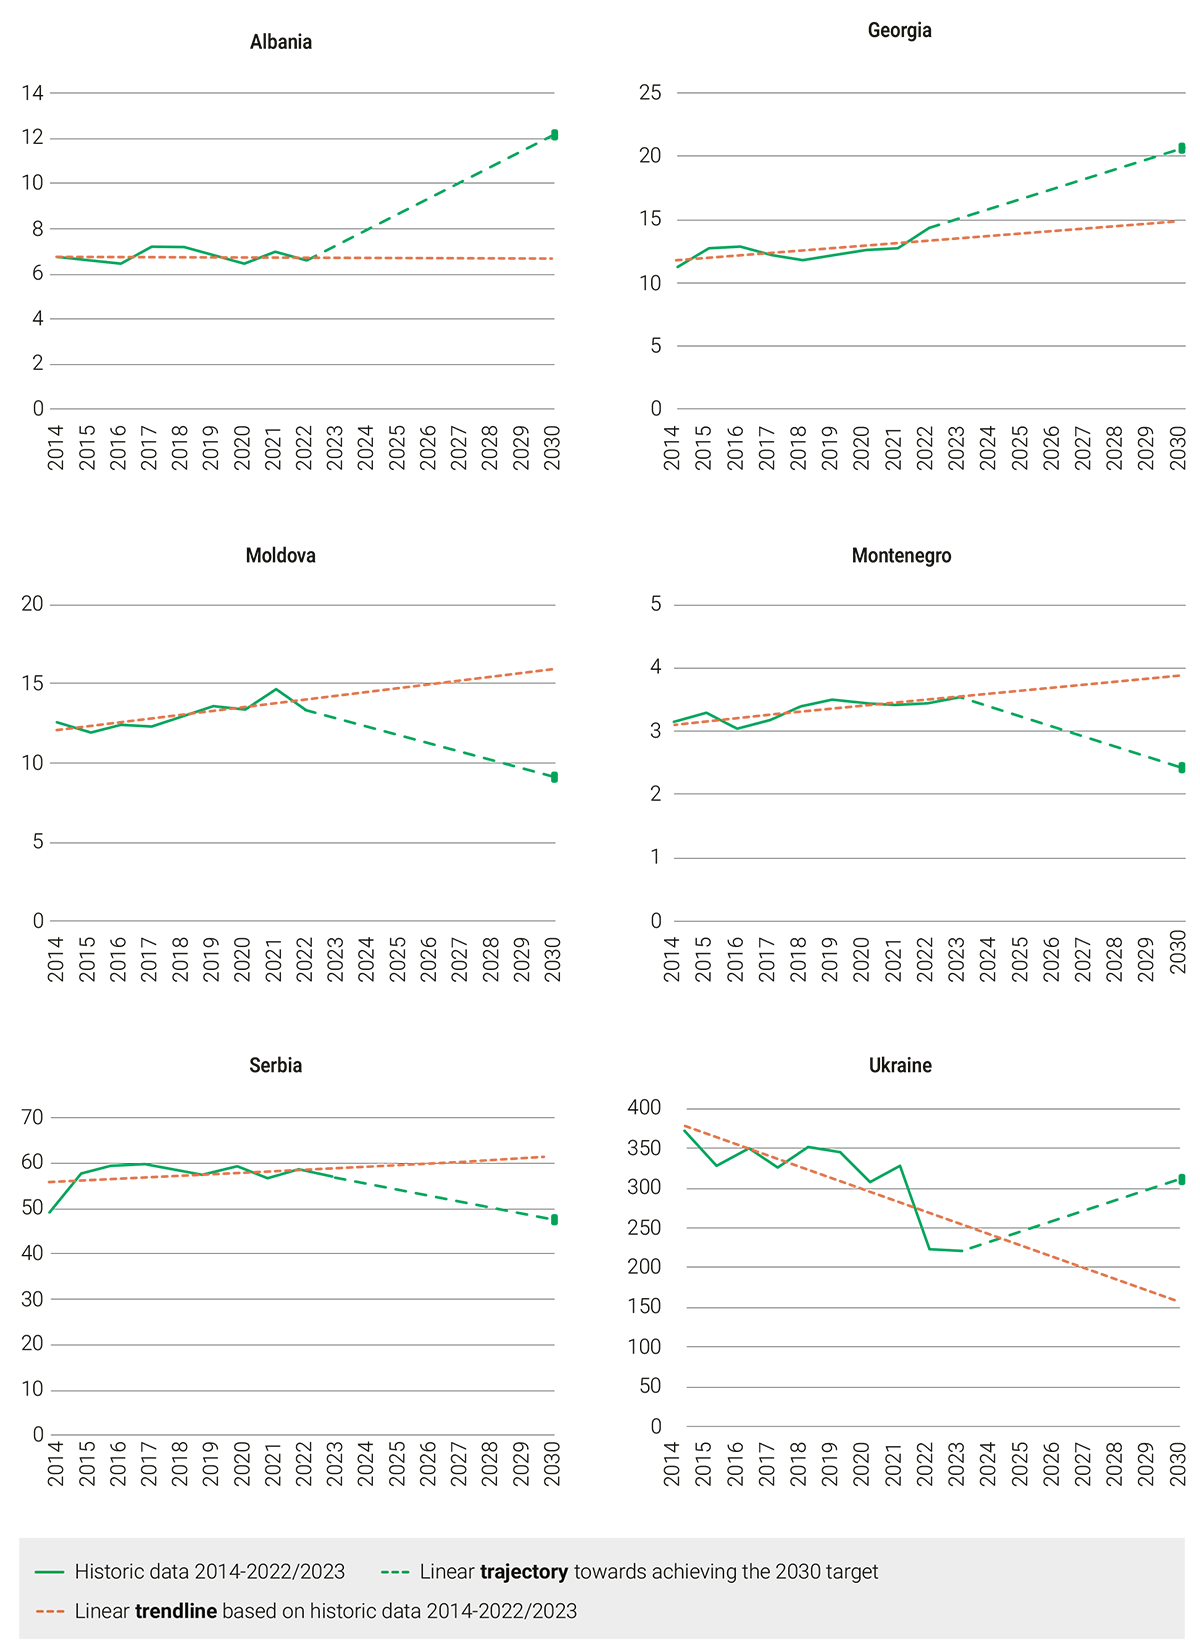
Note: Total GHG emissions include LULUCF, with the exception of Montenegro.Sources: Data on actual GHG emissions are based on Contracting Parties’ GHG inventory submissions under Del. Reg. 2020/1044. Linear trends are based on GHG inventory data showing the general direction of emissions in the past 10 years. Linear trajectories are for illustrative purposes and reflect linear pathways from the last historical year available (2022 or 2023) to 2030 targets. 2030 GHG targets are based on Decision 2022/02/MC-EnC.
-
Share of renewable energy
Share of renewable energy in gross final energy consumption by Energy Community Contracting Party
While many Contracting Parties are increasing the share of renewable energy in gross final energy consumption, only some have surpassed their 2020 target levels. The below figure visualises recent trends in the overall renewable energy share and compares them against the 2030 RES targets (as based on Decision 2022/02/MC-EnC).
Share of renewable energy in gross final energy consumption by Energy Community Contracting Party [%], 2021–2023 compared with 2020 and 2030 targets
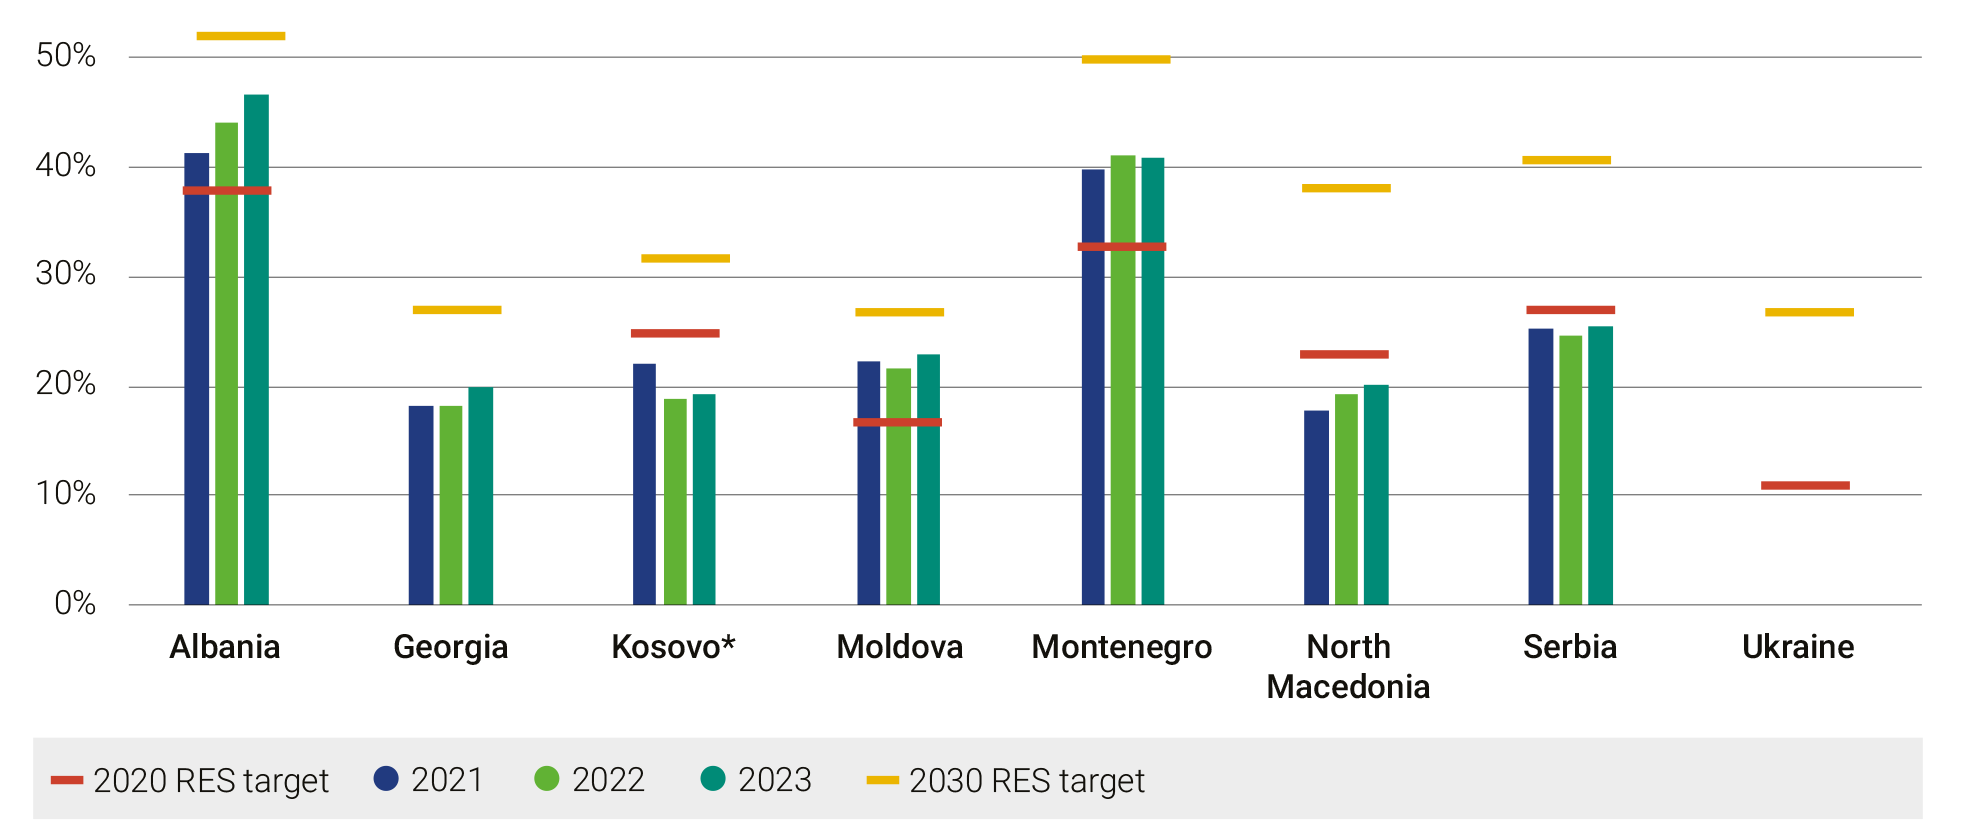
Source: SHARES tool (2021), submissions under Implemeting Regulation (EU) 2022/2299 Annex II, Table 1 (2022–2023). Targets are based on Decision 2022/02/MC/EnC, incorporating Directive (EU) 2018/2001. -
Primary energy consumption
Primary energy consumption per Energy Community Contracting Party
Many Contracting Parties recorded an increase in primary energy consumption (PEC) over the last decade. In most cases, this trend will need to be decisively reversed in order to achieve their 2030 PEC targets. By contrast, those Contracting Parties that have kept PEC broadly stable or achieved a steady decline appear to be on track to meet their binding 2030 targets. In a few Contracting Parties, recent crises continue to shape energy consumption patterns, bringing current trends broadly into line with the indicative trajectory towards 2030.The 2025 NECPRs reflect on a period, when most NECPs were still being developed and many structural reforms, policies and investment measures remained at the planning stage. The reported data therefore show where the Contracting Parties stood before full implementation began and provide a benchmark against which future progress can be measured.
Primary energy consumption per Energy Community Contracting Party [Mtoe], historical data (2014–2023) and indicative trajectories towards achieving 2030 targets (2024–2030)
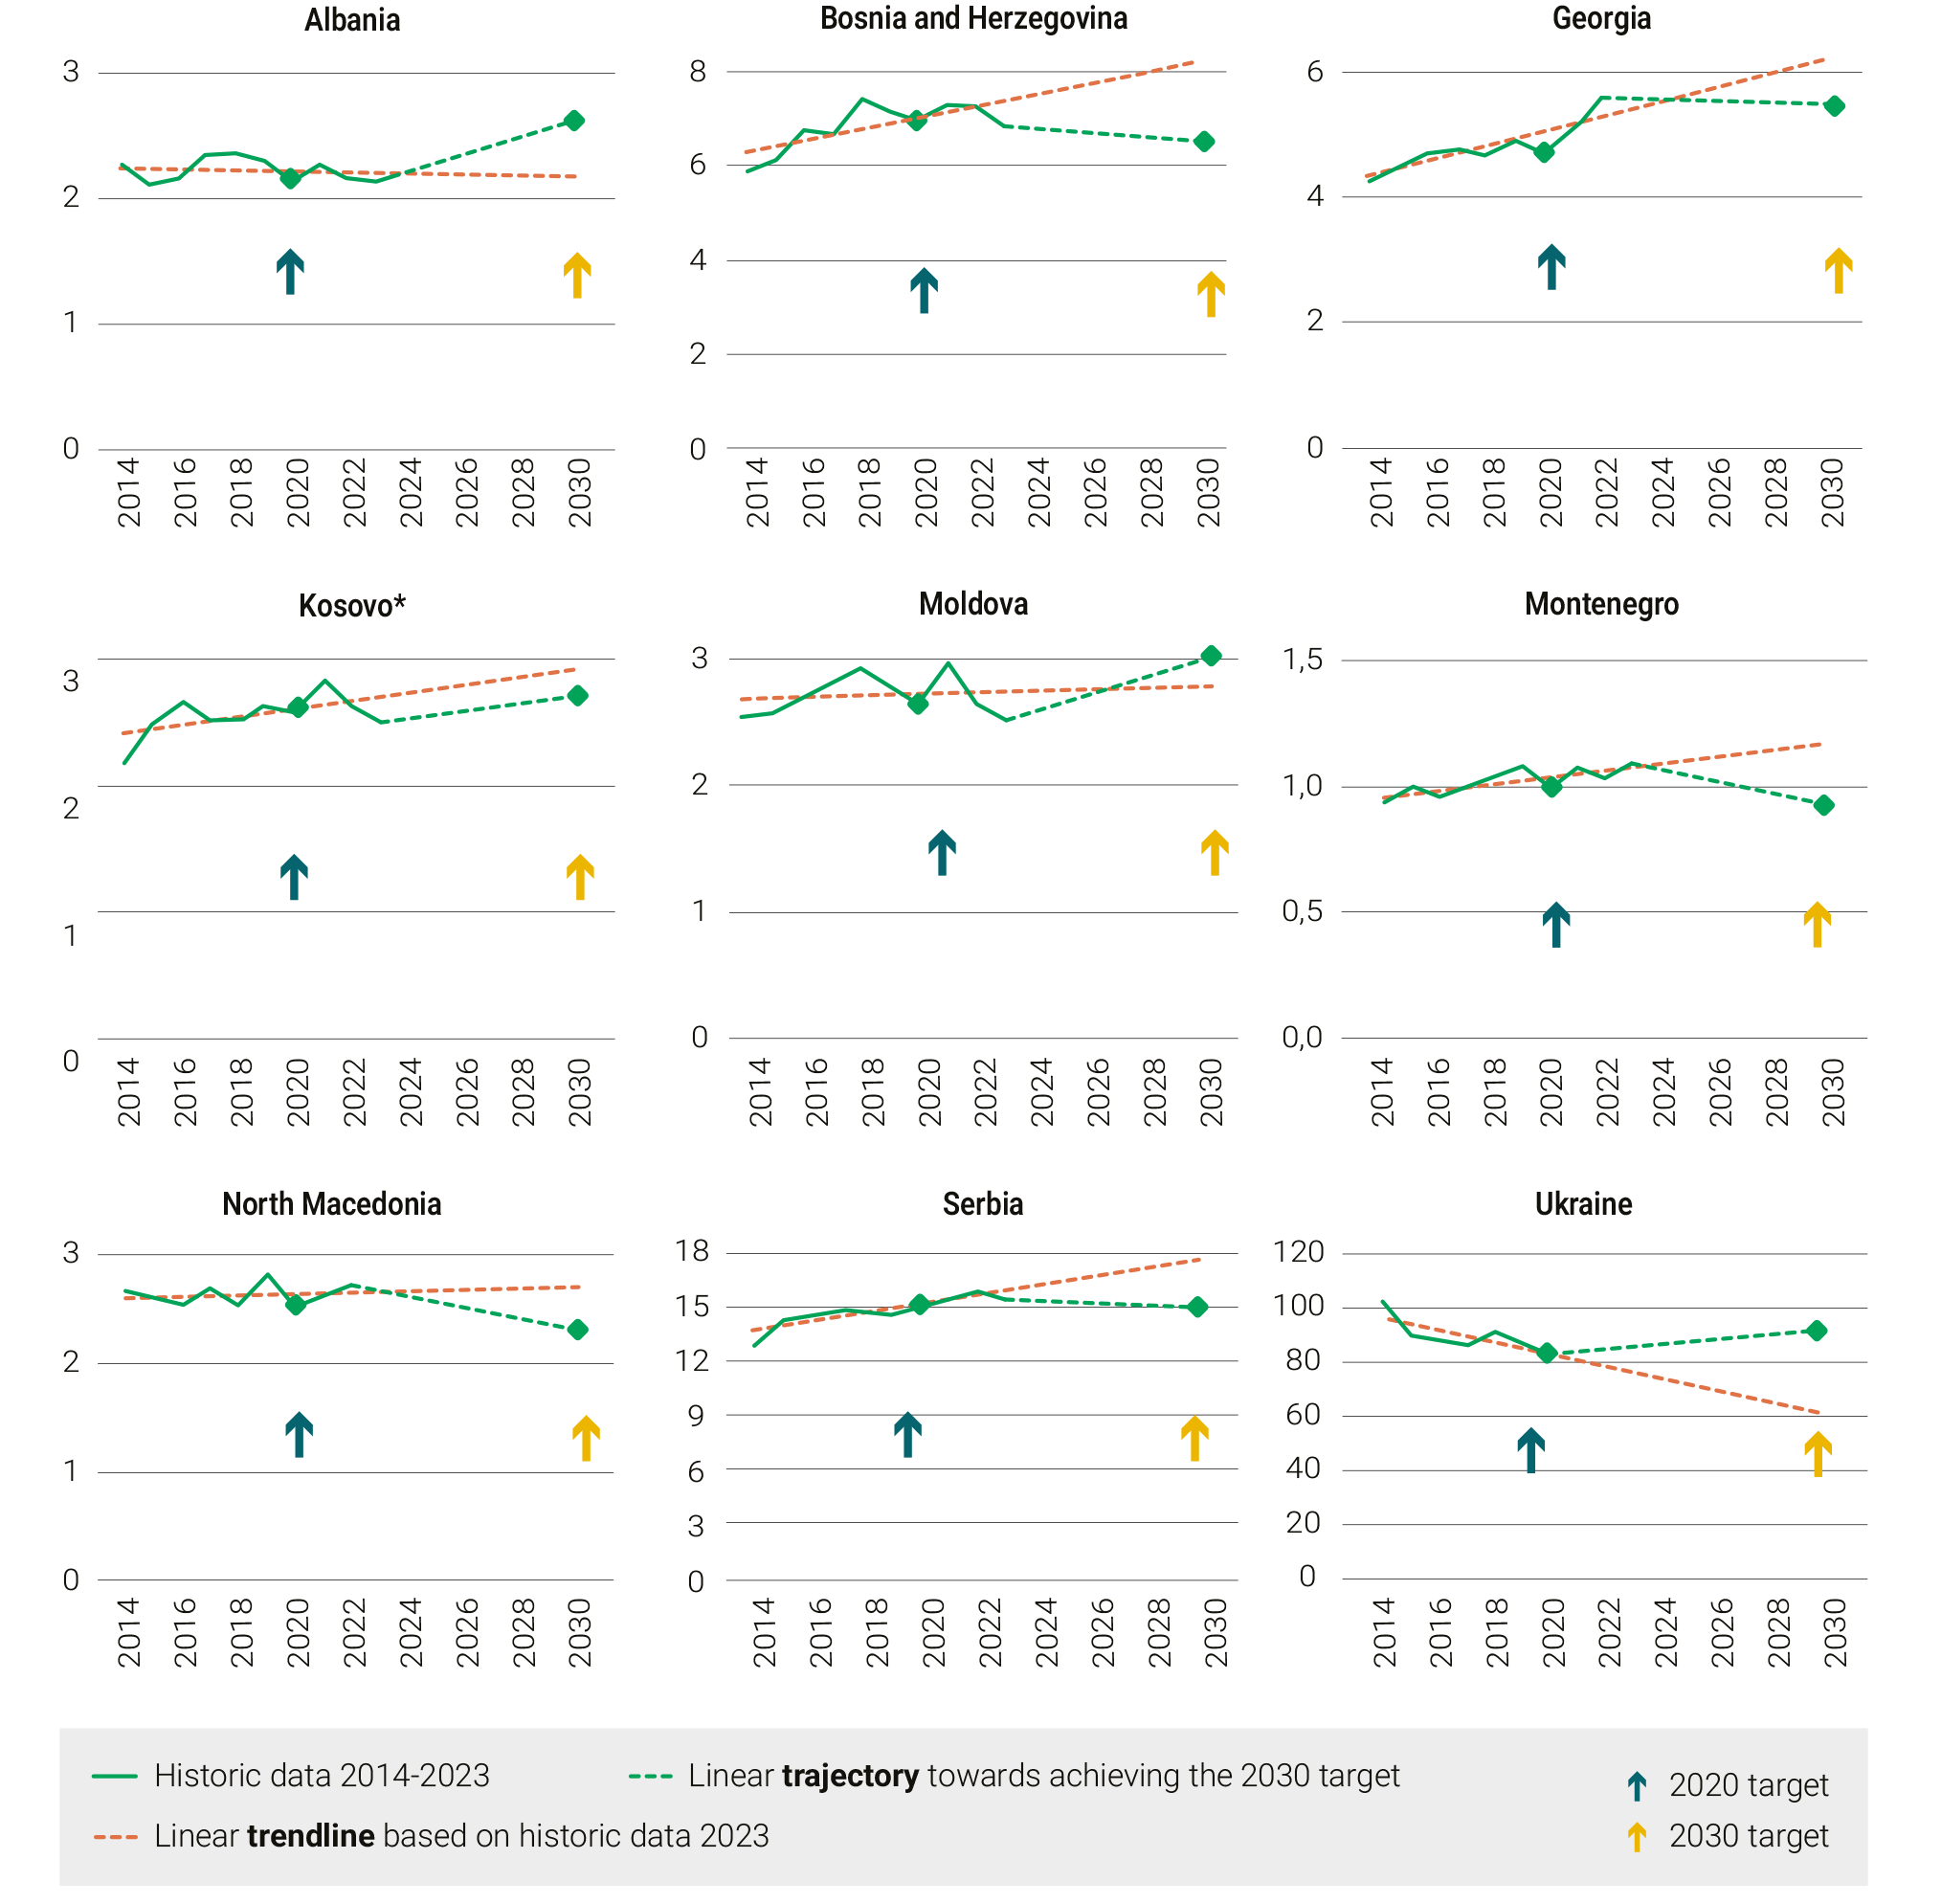
Source: Data on primary energy consumption are based on Eurostat energy balances (for the years up to 2021) and submissions under Impl. Reg. 2022/2299 Annex IV, Table 1 (for the years 2022–2023). Linear trendlines are based on historical data for primary energy consumption in the past 10 years, aiming to indicate the general direction. Linear trajectories are for illustrative purposes and reflect the linear pathways from the last historical year available (2022 or 2023) onwards to 2030 primary energy consumption targets (as per Directive 2012/27/EU, as amended by Decision 2022/02/MC-EnC).
-
Final energy consumption
Final energy consumption per Energy Community Contracting Party
Similarly to primary energy consumption trends, most Contracting Parties recorded an increase in final energy consumption (FEC) over the last decade. A few Contracting Parties appear to be on track towards achieving their binding 2030 FEC targets. Some others could also remain within the required consumption limits, provided current efforts are sustained. By contrast, the remaining Contracting Parties will need to step up their current efforts in order to align with their 2030 targets.
The 2025 NECPRs reflect on a period, when most NECPs were still being developed and many structural reforms, policies and investment measures remained at the planning stage. The reported data therefore show where the Contracting Parties stood before full implementation began and provide a benchmark against which future progress can be measured.
Final energy consumption per Energy Community Contracting Party [Mtoe], historical data (2014–2023) and indicative trajectories towards achieving 2030 targets (2024–2030)
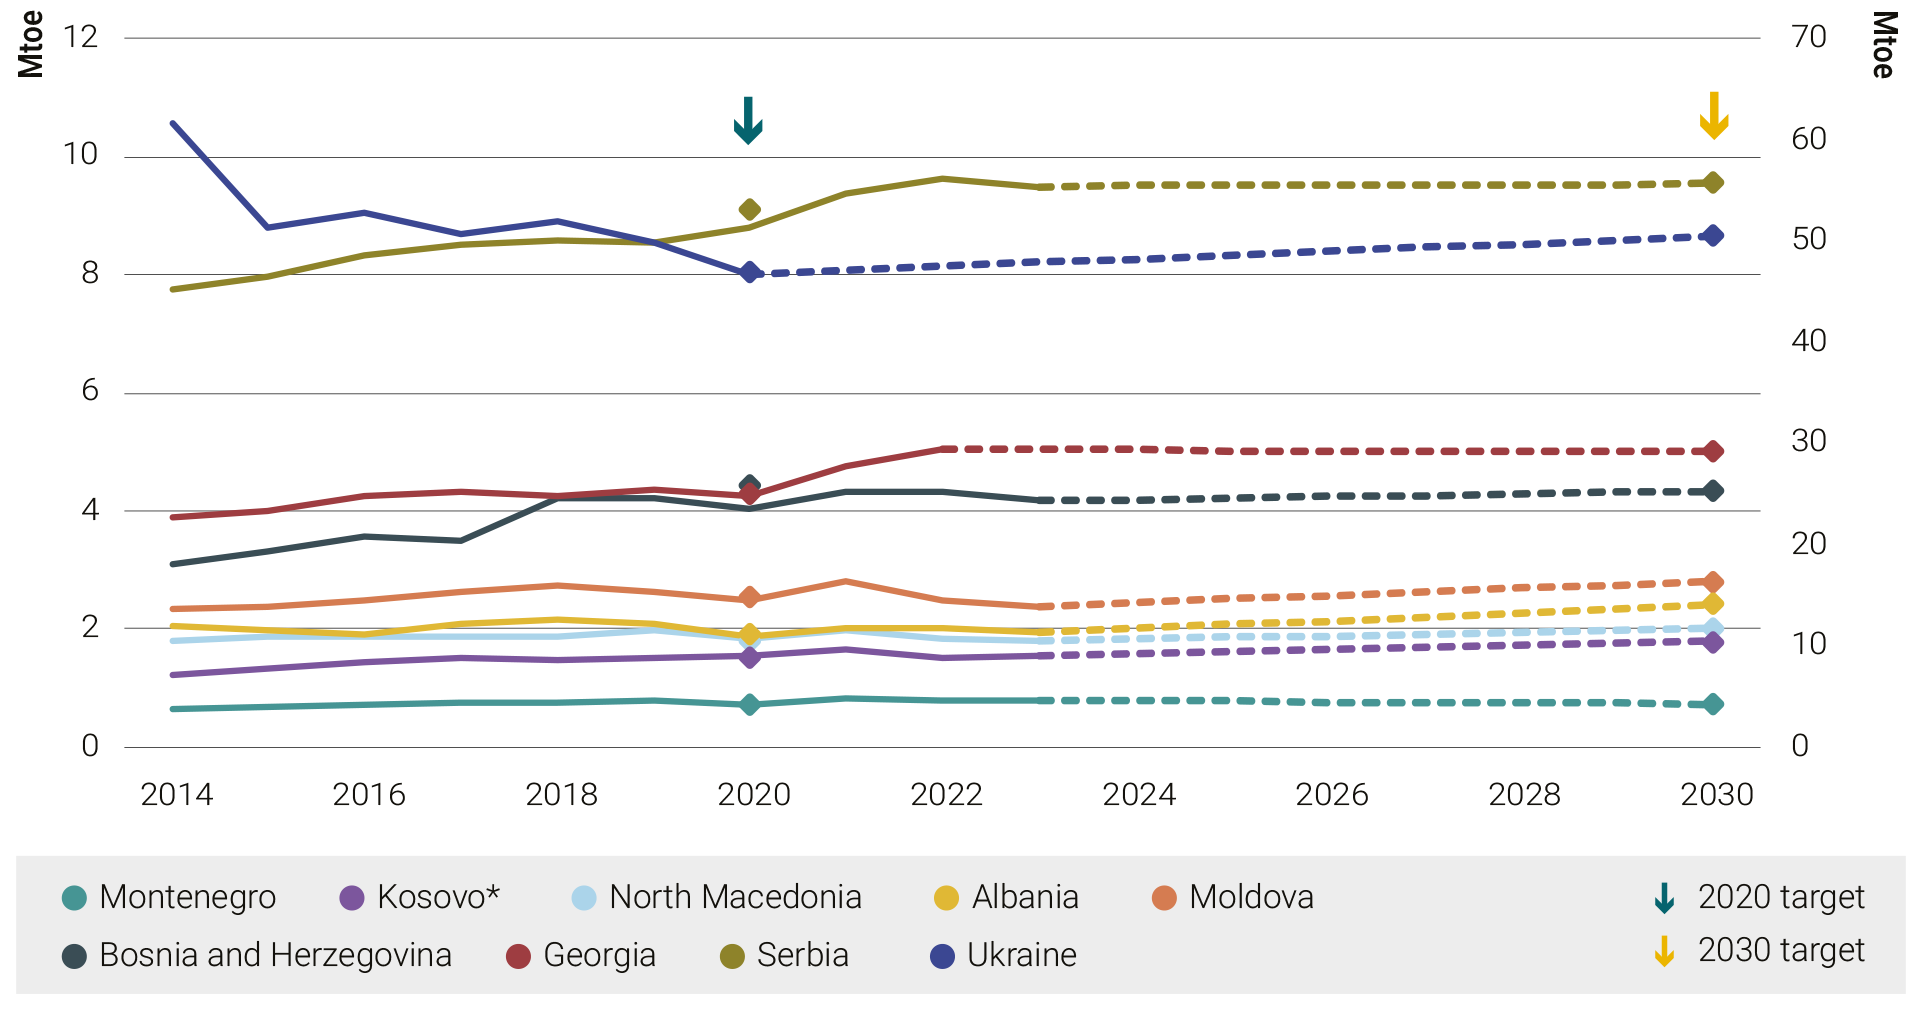
Note: The figure uses two Y-axes to enable the display of all Contracting Parties, with the right Y-axis reflecting Ukraine and the left Y-axis reflecting all other Contracting Parties.
Source: Data on final energy consumption are based on Eurostat energy balances (for the years up to 2021) and submissions under Implementing Regulation 2022/2299 Annex IV, Table 1 (for the years 2022–2023). Linear trajectories are for illustrative purposes and reflect the linear pathways from the last historical year available (2022 or 2023) onwards to 2030 final energy consumption targets (as per Directive 2012/27/EU, as amended by Decision 2022/02/MC-EnC).